Online Tool Tracks Impact, Success

One of the major challenges for any large-scale education, health, or economic development program is keeping track of activities and data, all while monitoring and evaluating progress. This means pulling together myriad pieces of information across multiple program sites and sharing it with those who need it.
EDC’s youth development program in Honduras is no different. But thanks to some technical savvy, program staff have come up with an innovative technology tool to help share information, make decisions, and improve programming.
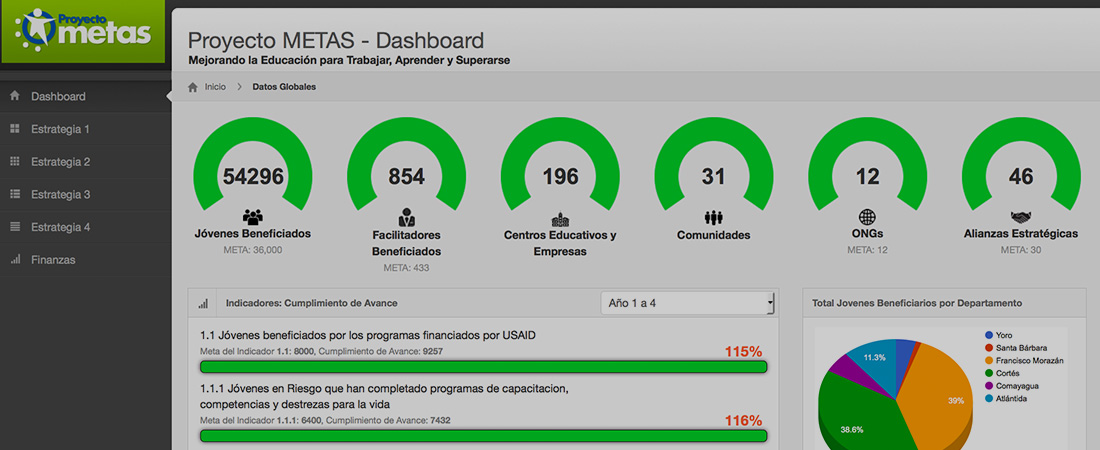
The new resource? A Web-based analytics dashboard that tracks the project’s progress using charts, graphs, and other visuals. It’s a window into Proyecto METAS’ impact—and it’s helping program staff constantly refine their activities.
“It’s interactive, verified, validated, and integrated management and evaluation data,” explains EDC’s Munir Mahomar, the project’s information management director and architect of the tool. “It allows us to spot trends in our work with youth, and also helps us make strategic changes that can improve what we are doing.”
Data about program effectiveness is important for Proyecto METAS, which is funded by the U.S. Agency for International Development (USAID). The project currently supports more than 100 technical high schools and vocational training programs by helping them offer relevant work readiness curricula. Some 22,000 graduates of the schools and centers are expected to earn workforce readiness certifications, putting them on the path to legitimate economic opportunities in one of the world’s most dangerous countries. The program has been recruiting 2,000 at-risk youth annually and expects to reach 10,000 out-of-school youth by 2014.
That’s a lot of data to track. But the dashboard helps the METAS team figure out whether they are meeting their programmatic goals—and also helps them identify opportunities for improvement.
Impact at a glance
Proyecto METAS’ dashboard data is free and available for anyone to see. This transparency offers partners, program staff, and funders the ability to check in on METAS’ progress, independent of the formal reports provided by the team.
“All the program data are broken down by cities and strategic goal,” says EDC’s Gustavo Payan, METAS project director. “So I can look at the dashboard and see where we are reaching a lot of youth and where we are not. That information helps us work harder in those communities to make sure that young people know about all of the opportunities that METAS offers.”
As long as he has an Internet connection, Payan can use the dashboard to see how many schools, communities, private businesses, and nongovernmental organizations METAS has reached. He can even filter the data to see specific results in individual schools and cities.
Payan says this represents a marked change from how programmatic data have historically been tracked.
“In the past, I didn’t have all of this data consolidated into one place,” he says. “I often had to e-mail people to get impact numbers, and it wasn’t usually broken down by different locations or populations. It was really hard to measure the type of progress we were making.”
Maintaining the dashboard is simple, too—it only requires staff to enter impact data into the project’s database. The dashboard then tabulates all of the information and prepares updated visual reports.
EDC is already using this model to build similar dashboards for its international work and other specific projects. And Mahomar believes the dashboard could have an impact well beyond the small Central American country.
“These innovative technological tools have the power to improve the quality of education and training programs, in Honduras and around the world,” he says.